How Up-to-Date Construction Data is Improving Worksite Operations
The construction industry makes up 14.7% of the world GDP, and it’s grown 2.3% in the last five years. In the US alone, construction spending is $1.231B, making it one of the largest industries worldwide. However, it’s also one of the least digitized sectors in the world, second only to agriculture.
This, and a host of other factors, has lead to a $1.6T productivity gap, according to McKinsey & Company.
But new technologies, like commercial drones, machine automation, and site data visualization software, have the potential to rapidly close that gap and bring the industry fully into the digital age.

For many companies, the future of data is already here
In light of recent rapid technological changes in the industry, we at Propeller put together a report on construction industry trends and predictions for 2019 reflecting on the factors shaping today’s industry and some forecasting on where it’s headed.
That said, for many companies, the future of data is already here. They’re using new tools in the field and in the office.
The only question is, how?
To answer that, we talked to a number of real customers to see how real companies are leveraging new tools, from drone surveying to the Propeller Platform, to improve site work of all kinds in construction the world over.
With more data captured than ever, how is it used?
While the capture methods for site data vary, many sites use commercial drones, traditional surveying equipment, and/or autonomous machines to do work and gather data. What we’ll be focusing on here is how that data is used and by whom.
Specifically, we’ll be exploring how site personnel use data visualization and advanced analytics to do their jobs.
Roles and responsibilities vary from construction site to construction site. In an effort to address varied issues cropping up for different people in different positions, we’re outlining how surveyors, engineers, and PMs use new tools and data visualization in their day-to-day work below—and how it’s used to communicate with clients and the home office.
How Every Level of a Jobsite Uses Site Data
After interviewing a number of current Propeller or Trimble Stratus users, a few key themes popped up in how they use drone surveying and visualization platforms in their work.
-
More efficient data capture
-
Smoother interdepartmental data sharing
-
Seamless team and company collaboration
-
The best ways to train others on using new software
-
Future trends in the construction industry
We also found that often the first people to use a new tool like the Propeller Platform are a part of a company’s survey team. This seemed to be because data visualization was built upon photogrammetric drone surveying, traditionally the domain of the surveyor.
A majority of the first-person interviews held to research this guide were with different survey managers at companies from Kansas to New Zealand.
Improving your business through digital transformation can start small
Companies big and small face pushback from different sources on proof-of-concept to scalability. The good news is that closing that productivity gap by improving the productivity of your own jobs is not an all-or-nothing situation. You can start small.
We’ve seen companies of all sizes start increasing their own productivity with new technology, including:
-
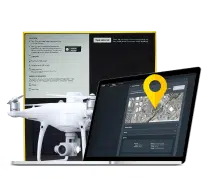
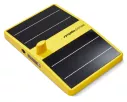
Using a PPK drone surveying solution like Propeller PPK to reduce a surveyor’s time in the field, freeing them up for other work.
-
Using a service to process survey data and provide up-to-date surfaces, reducing the time spent processing in-house, sometimes by days.
-
Using machine control to turn a mediocre operator into an excellent one by giving them real-time feedback to ensure they’re on grade.
-
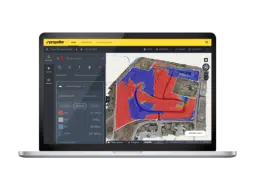
Using a data visualization and analytics platform like Propeller to store all your site data in one place, simplifying sharing.
-
Using Propeller to model site data in 3D, creating a virtual reality or video-game look for design surfaces, cut/fill volumes, elevations, and more. An accurate picture is worth a thousand spreadsheets.
These are just a few of the ways the people we met above are making their site data work for them, just a few ways they’re digitizing their sites and improving efficiencies with technology available to all.
Learn how people in your role are using up-to-date site data to improve construction operations by downloading our full ebook.
